The Geographical Distribution of the Nurse Surname
In a previous article I described the Etymological origins of the surname Nurse. I will now describe my research on the geographical distribution of the name.
One of the benefits of major online Genealogical resource sites like (“Ancestry.com” 2023) and (“Find My Past” 2023) is that there are now quite a lot of complete nation-wide data sets that can be used in order to analyse the distribution of family names. It takes a bit of work but the data can be gathered and analysed quite easily
The first step in locating the geographical home of a family name is to establish the current distribution. It is surprising how often family names, even after all the mobility of modern times, are still rooted in or near the places where they were first recorded in the Middle Ages. I therefore start the analysis with a recent data set (2005) of the registered voters for the UK. (“UK, Electoral Registers, 2003-2010” 2018) This data set should contain most of the adult population over the age of 18.
The data is plotted by Ceremonial County (see Figure 1). The mapping software (“MapChart.net” 2023) offered the possibility of a number of different Uk maps. As the data was from a modern data-set it made sense to use the modern Ceremonial Counties of England and Wales for the chart.1 The data is plotted as the number of Nurse registered voters in a particular county divided by an estimate of the total number of registered voters.2
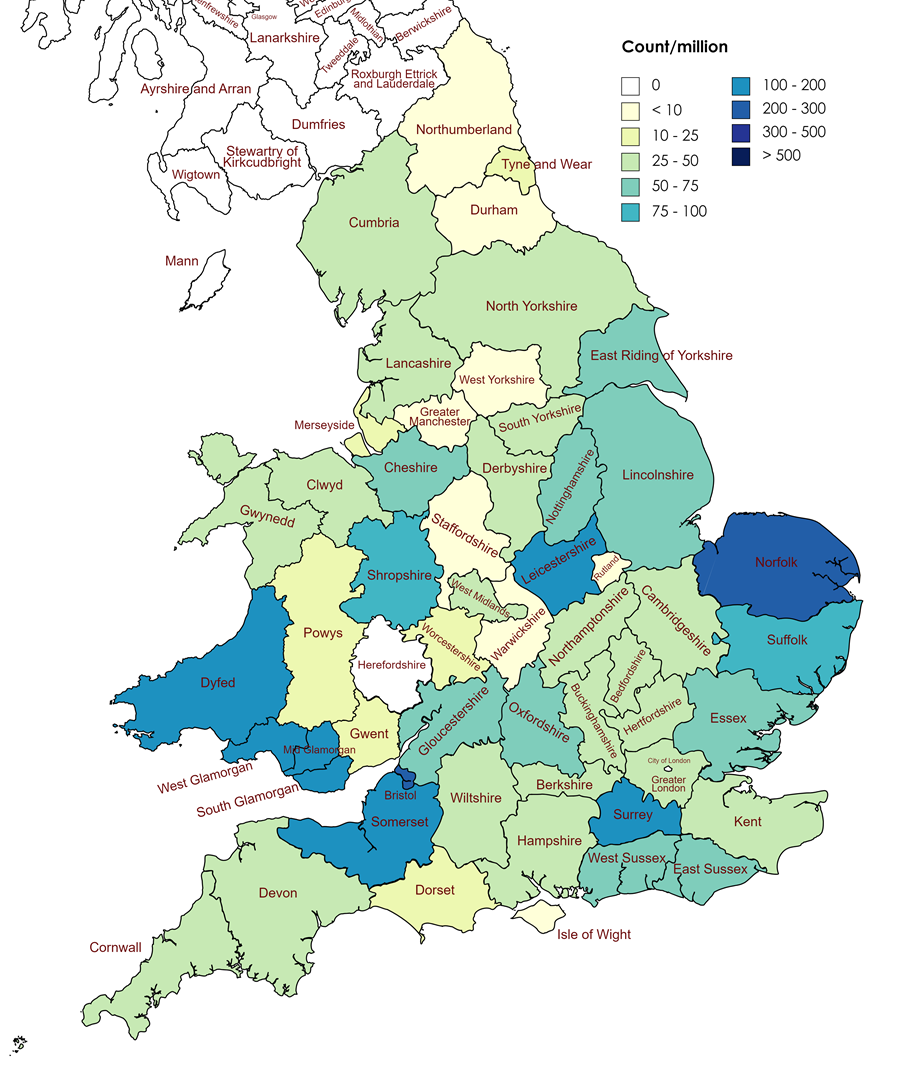
While the effects of mobility for about 100 years is quite clear as almost every county in the country has at least 1 Nurse registered voter, the notable exceptions being Herefordshire and the City of London, there are three areas where the Nurse name is concentrated.
These are:
- a group of counties in the East of England, most notably the counties of Norfolk (207/million), Leicestershire (137/million) and to a lesser degree Suffolk (91/million).
- South Wales with the 4 counties having an average of 150/million
- Bristol (255/million) and Somerset (110/million).
Although Bristol has the largest number of Nurses per population, Norfolk actually has the largest number in absolute terms (141 vs 89)3
The next step in determining the geographical source of a family name is to use older record sources. One obvious set of sources are the censuses taken every 10 years starting in 1841.4 Rather than jumping back over a hundred years there was a pseudo-census carried out in 1939 that we can use - the so-called England and Wales Register of 1939 - which is available on Ancestry (see “1939 England and Wales Register” [1939] 2017). In this case (see Figure 2) the data was plotted as the number of Nurses in a particular county divided by an estimate of the county’s population5 using a map of the Historic Counties of England and Wales (see “Historic Counties of England” 2023)
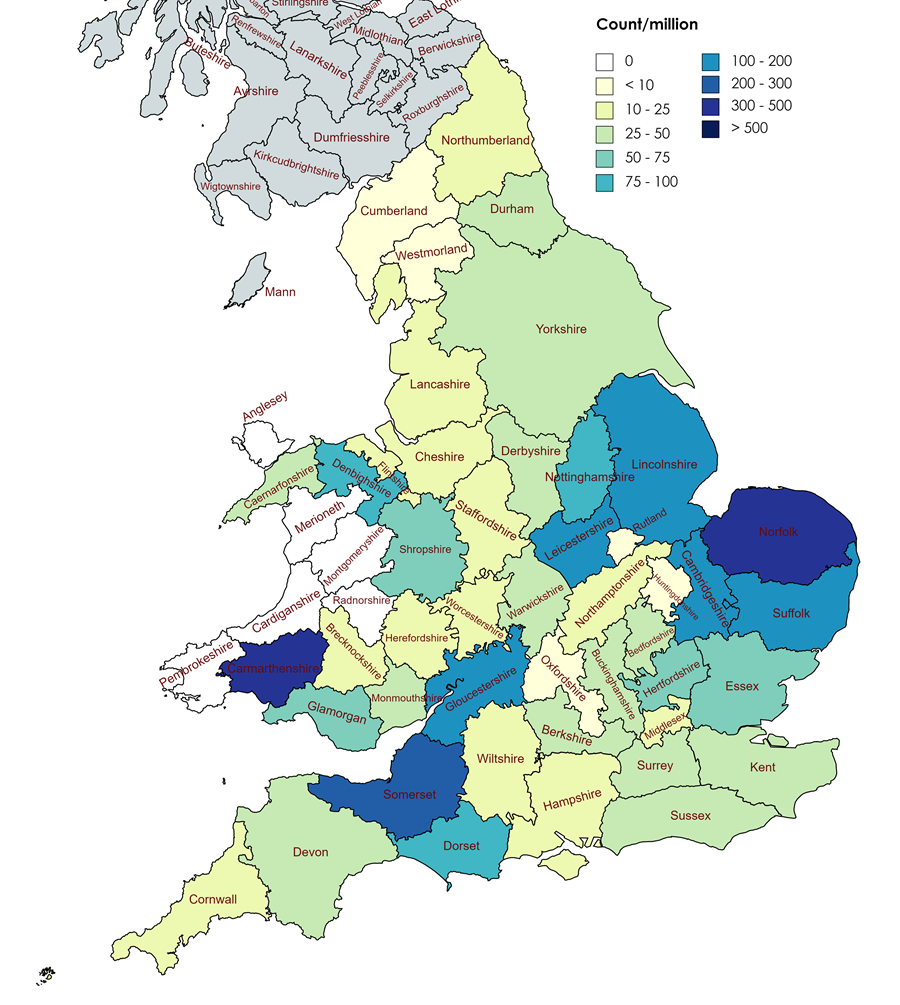
It is clear from this map that, although every english county has at least one Nurse, the three clusters of Nurses were even more evident 80 years ago.
- The largest group of Nurses is in 5 counties (Lincolnshire, Leicestershire, Cambridgeshire, Norfolk and Suffolk) in the east of England which represents just over 25% (434) of the total, of which over half are found in Norfolk (13% or 234)
- The next largest group of Nurses is in 3 counties (Gloucestershire, Somerset and Dorset) in the west of England which represents just over 14% (249) of the total, over half of whom (8% or 134)are found in Gloucestershire which includes most of Bristol
- The third group of Nurses is in 2 counties in South Wales (Carmarthenshire and Glamorgan) which represents about 7% of the total.
These three groups of Nurses represents nearly half of the total, with the rest spread throughout the country.
Next we can look at the 1851 census (“1851 England Census” [1851] 2005; and “1851 Wales Census” [1851] 2005), which pushes our analysis back nearly 90 years. As before the count of Nurses is plotted (Figure 3) by Historic County against the population as measured in the Census.6
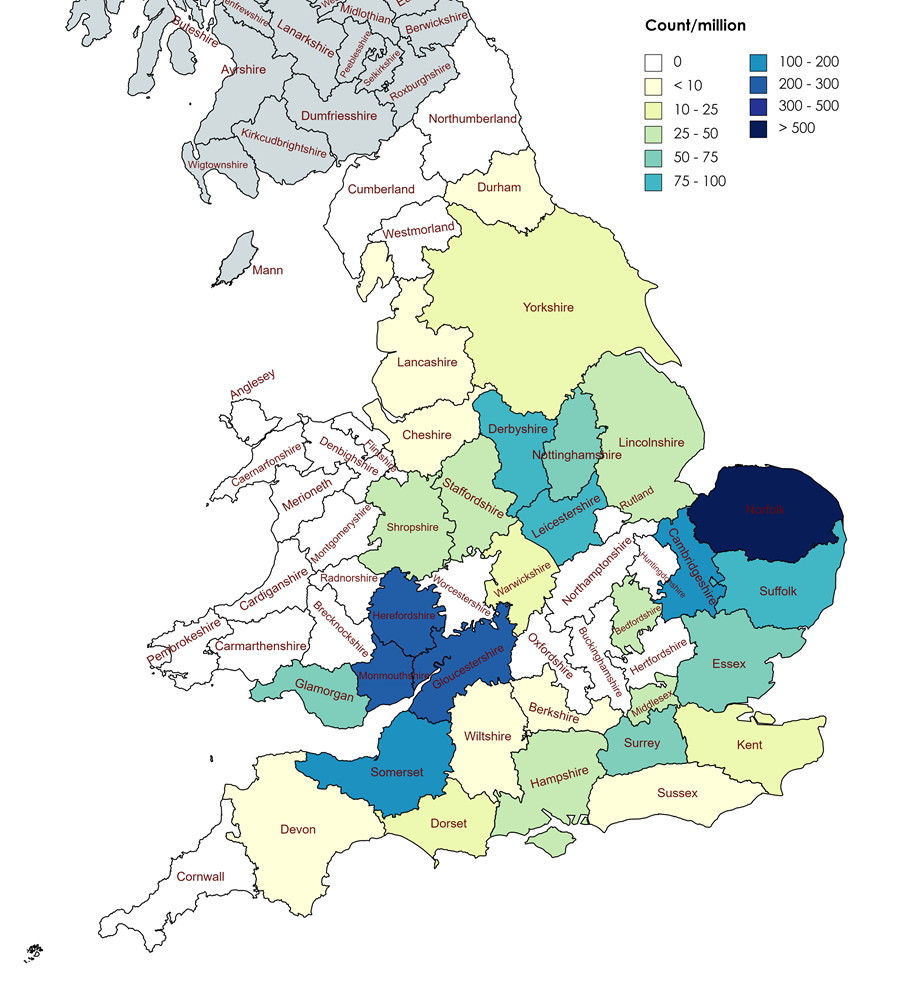
This time the groups have coalesced significantly and there really are only two groups of Nurses.
- The largest group is again based on Norfolk. In fact it really is just Norfolk, which has 335 Nurses, which represents on its own over 35% of the total.
- The second largest group is that represented by Gloucestershire (108 or 11.4%) and Somerset (71 or 7.5%) for a total of 179 (or 19% of the total). While this group could contain the counties of Herefordshire and Monmouthshire based on the count/million, their contribution is quite small due to the small populations of those counties which magnify the contribution in the chart.
Let’s look at these two regions in more detail, starting with the cluster based on Norfolk.
While there are concentrations of Nurses throughout Norfolk, Suffolk and Northern Cambridgeshire, the largest concentrations are centred on King’s Lynn and Downham Market, and Weybourne on the North Coast. In particular there are five large clusters of Nurses:
- 62 within 2 miles of Weybourne
- 27 in King’s Lynn
- 29 in and around Dersingham, about 6 miles north east of King’s Lynn
- 23 in and around Wisbech in Cambridgeshire about 8 miles to the south west of King’s Lynn, and by far the largest group
- 80 in the triangle bounded by Downham Market, Swaffham and Thetford, about 10 miles slightly west of south of King’s Lynn
In fact of the 359 (38%) of the Nurses in the 1851 Census in Norfolk and Cambridgeshire, 159 (17%) are located within 12-15 miles of King’s Lynn.
Turning our attention to the group in Gloucestershire and Somerset, we can identify 4 clusters of Nurses
- 34 centred on Hanham, Bitton and Oldland, and the western environs of Bristol
- 27 south of Bristol in Bedminster, Dundry and Compton Dando
- 34 in the area of Somerset between Shepton Mallet and Wells, and
- 39 centred on Stroud and Stonehouse in Gloucestershire
In 1851, most (if not all) of the Nurses in the Hanham/Bitton area are my ancestors and their descendants, as are many of those in the group to the south of Bristol.
To conclude this discussion, we can postulate two scenarios;
- the name originated in a few locations independently, or
- the name originated in one location and a descendant moved to the second location, where the family prospered.
Prior to the national censuses of the 19th century there are no sets of data that are as complete. We are therefore left with these two scenarios.
Since I have been able to trace my Nurse ancestry back to the late 17th century to Chew Magna in North Somerset, it is likely that my Nurse line originated somewhere in Somerset.
References
“1851 England Census.” (1851) 2005. Ancestry.com. 2005. https://www.ancestry.co.uk/search/collections/8860/.
“1851 Wales Census.” (1851) 2005. Ancestry.com. 2005. https://www.ancestry.co.uk/search/collections/8861/.
“1939 England and Wales Register.” (1939) 2017. Ancestry.com. 2017. https://www.ancestry.co.uk/search/collections/61579/.
“2005 United Kingdom General Election.” 2023. Wikipedia; Wikimedia Foundation. 2023. https://en.wikipedia.org/w/index.php?title=2005_United_Kingdom_general_election&oldid=1161944417.
“Administrative Counties of England.” 2023. Wikipedia; Wikimedia Foundation. 2023. https://en.wikipedia.org/w/index.php?title=Administrative_counties_of_England&oldid=1146865547.
“Ancestry.com.” 2023. 2023. https://www.ancestry.com.
“Ceremonial Counties of England.” 2023. Wikipedia; Wikimedia Foundation. 2023. https://en.wikipedia.org/w/index.php?title=Ceremonial_counties_of_England&oldid=1151821485.
“Find My Past.” 2023. 2023. https://www.findmypast.com.
“Historic Counties of England.” 2023. Wikipedia; Wikimedia Foundation. 2023. https://en.wikipedia.org/w/index.php?title=Historic_counties_of_England&oldid=1156453561.
“MapChart.net.” 2023. 2023. https://www.mapchart.net.
Southall, Humphrey, and the Great Britain Historical GIS Project. 2009-2017. “A Vision of Britain Through Time.” Department of Geography, University of Portsmouth. 2009-2017. https://www.visionofbritain.org.uk/census/table_page.jsp?tab_id=EW1921GEN_M8&show=DB.
“UK, Electoral Registers, 2003-2010.” 2018. Ancestry.com. 2018. https://www.ancestry.co.uk/search/collections/61579/.
Footnotes
-
The modern Ceremonial Counties were created by the Lieutenancies Act of 1997 (see “Ceremonial Counties of England” 2023)↩
-
The number of registered voters in each county was estimated by using the population data for 2018 (see “Ceremonial Counties of England” 2023) and adjusting by the total number of registered voters for the 2005 General Election (see “2005 United Kingdom General Election” 2023). (County Population) * (Total No of Registered Voters) / (Total Population)↩
-
Technically Greater London has the largest number of Nurses per population, but this is primarily due to its extremely large population compared with any other county under consideration.↩
-
(“Ancestry.com” 2023) has all the censuses up to 1911 and (“Find My Past” 2023) has all the censuses up to 1921. Later censuses are not available as Census data is only released after 100 years to protect the personal data of individuals that are still alive.↩
-
The estimate of a county’s population was calculated using the closest available census, that of 1921.(see Southall and Great Britain Historical GIS Project 2009-2017) As this data is based on Administrative Counties (see “Administrative Counties of England” 2023), which are different from either the new Ceremonial Counties and the Historic Counties, the population of the County of London had to be divided between the counties of Middlesex (60%), Surrey (30%) and Kent (10%). The percentages used were somewhat arbitrary and very much a guesstimate.↩
-
This time both the Census data and Population data are reported by Historic County (see “Historic Counties of England” 2023) as the census pre-dates the creation of the Administrative Counties (see “Administrative Counties of England” 2023)↩